How to see Insights on Instagram: ultimate guide

You can use metrics in Instagram Insights to analyze your marketing strategy and create a social media report. But it is available only in Professional accounts. If you have a Private one, switch it to a Business or Creator. Read on how to switch and set a profile for your brand.
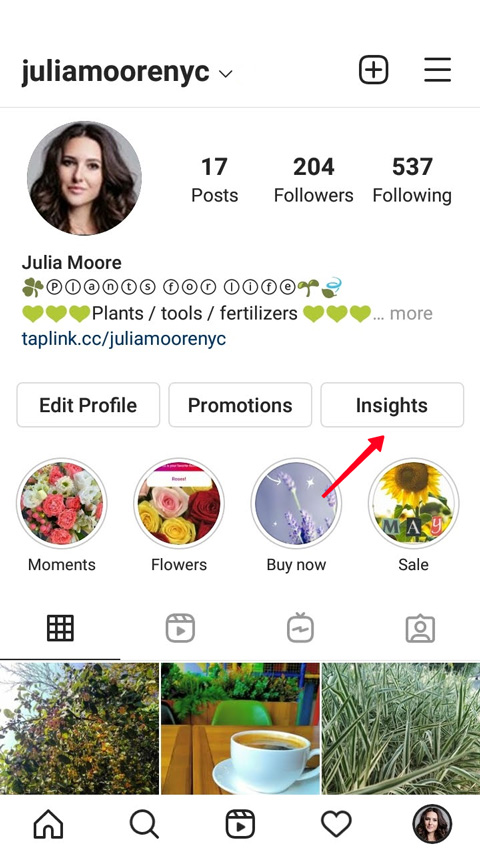
You can go to Instagram Insights right from your profile page.
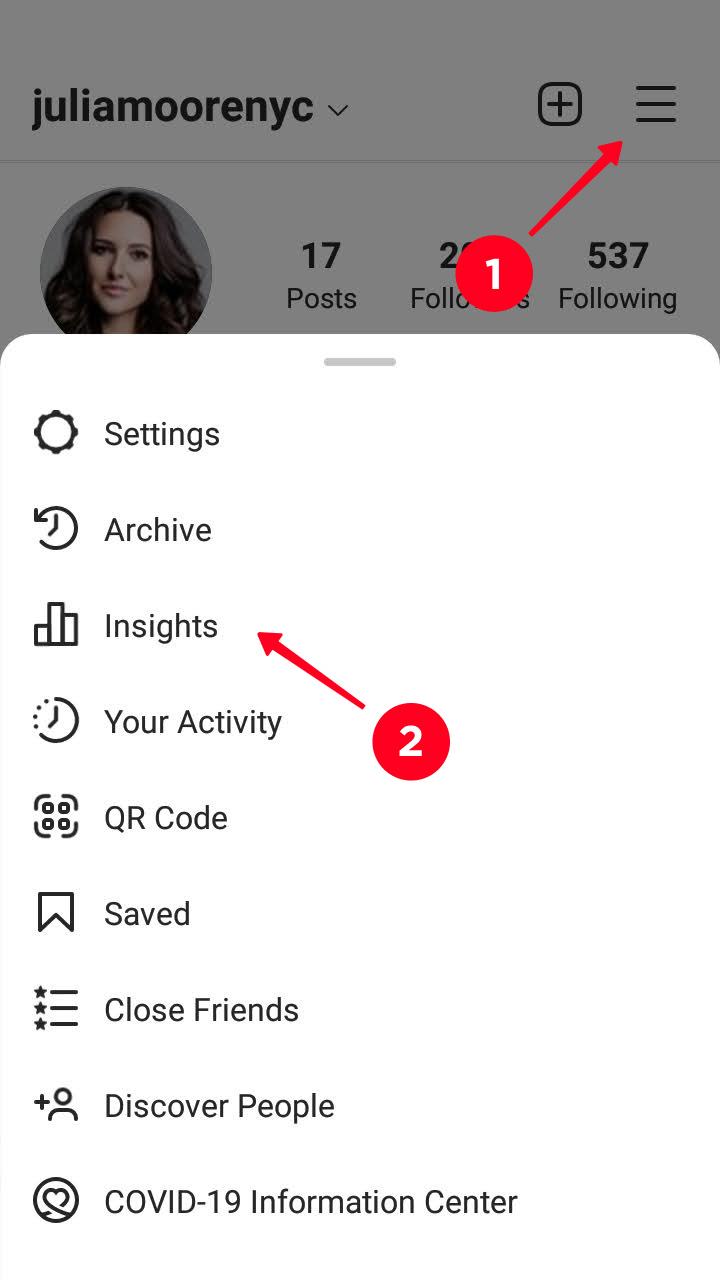
You can also check Instagram Insights by opening the settings.
Instagram Insights allows you to check general statistics on your profile page. You can change the period for which it is shown.
01. Disclose the menu on the left.
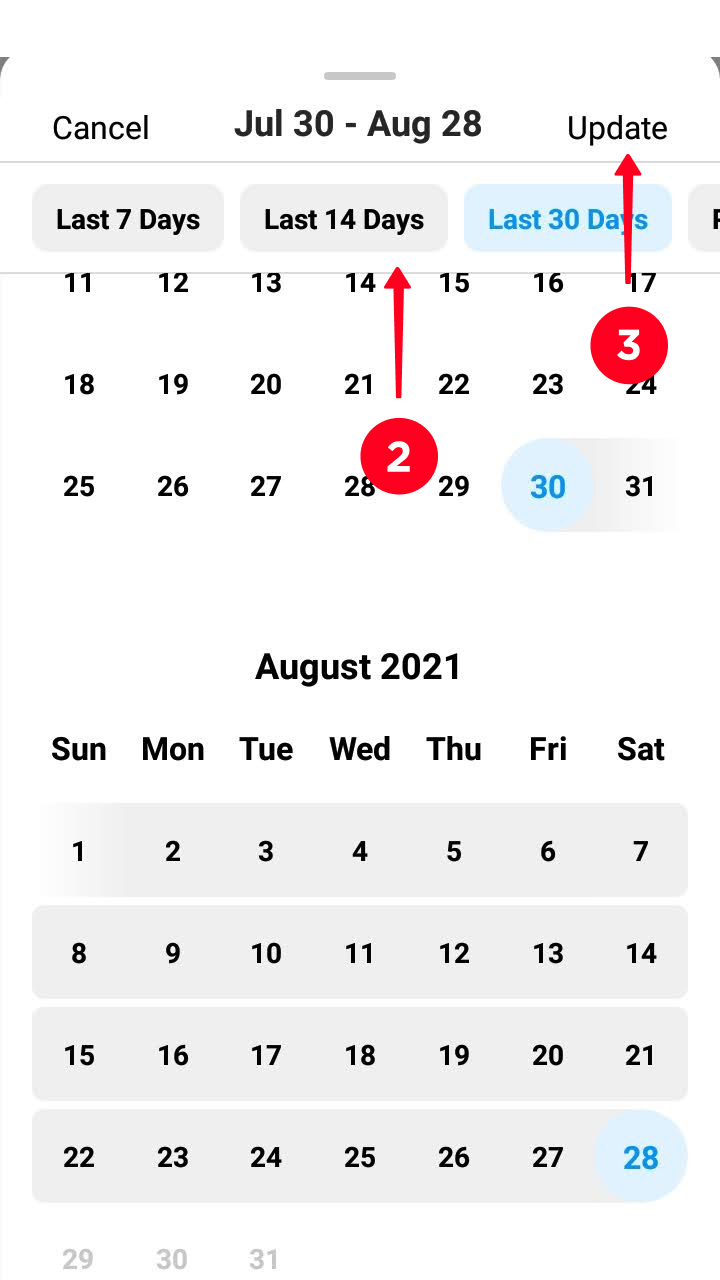
02. Choose the last 7, 14, 30, 90 days or Previous month. You can also set any period from 1 to 90 days. To do it, tap the day you need, or the first and the last days.
03. Tap Update.
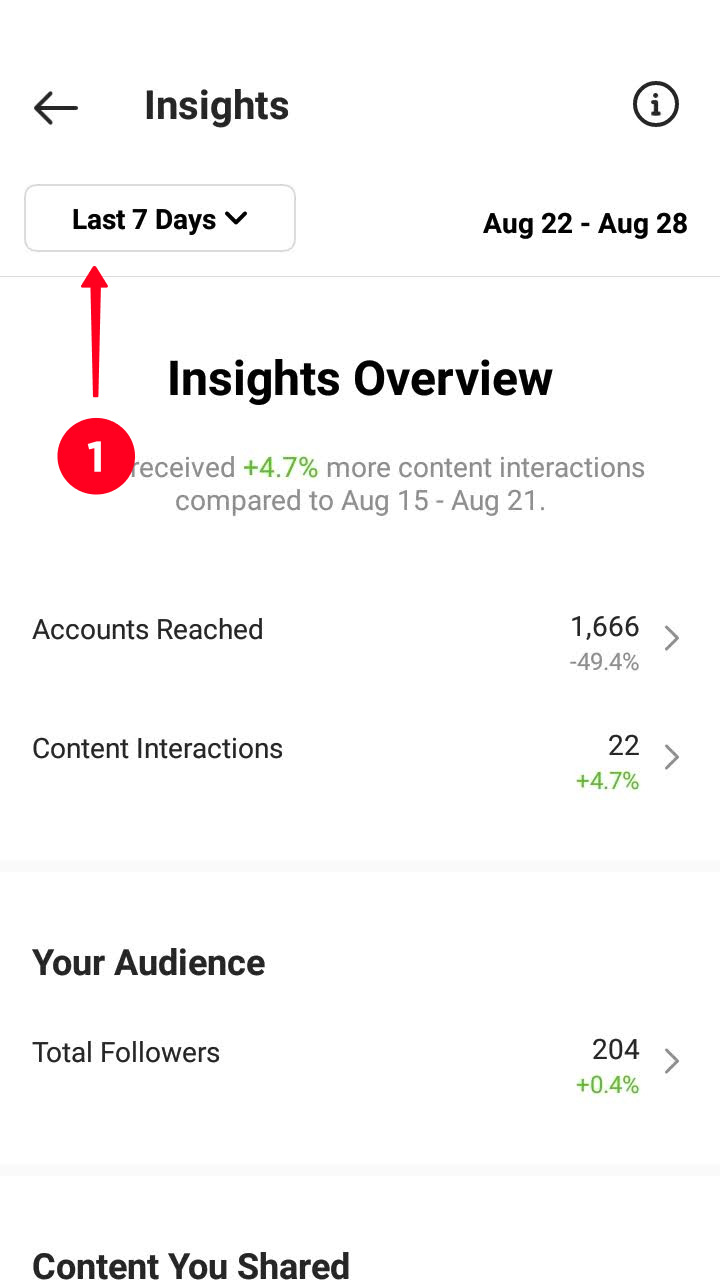
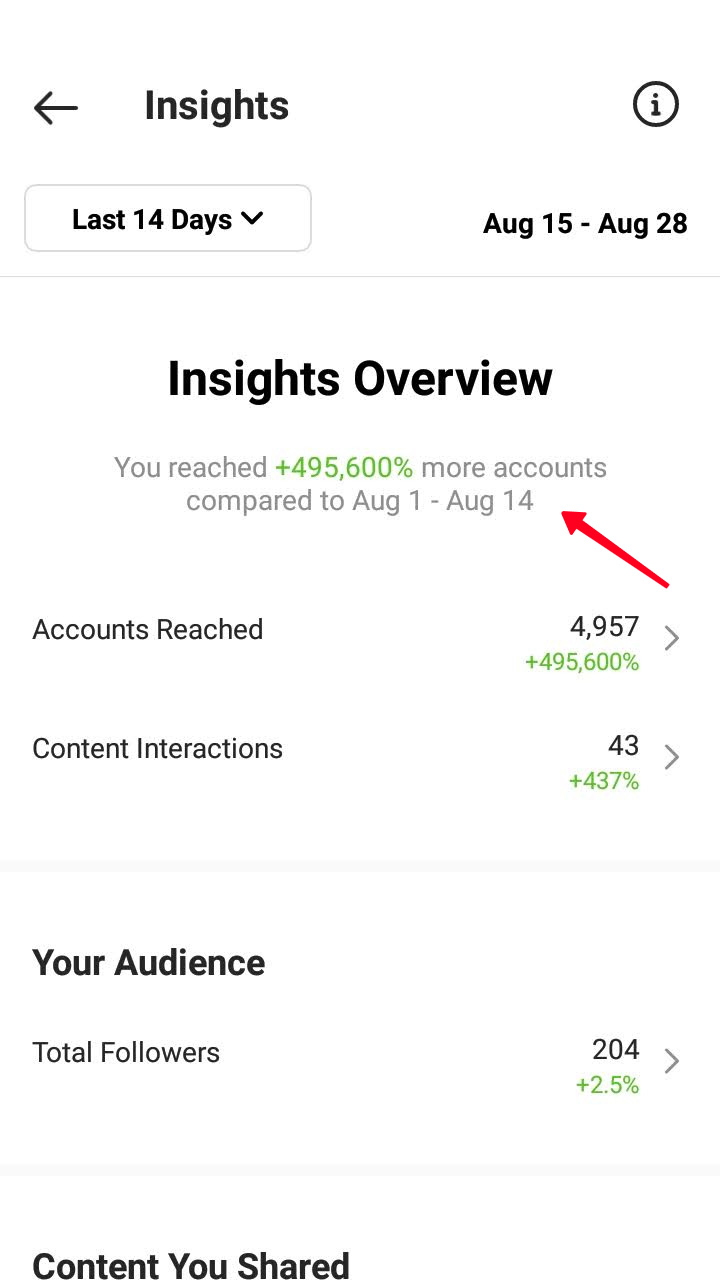
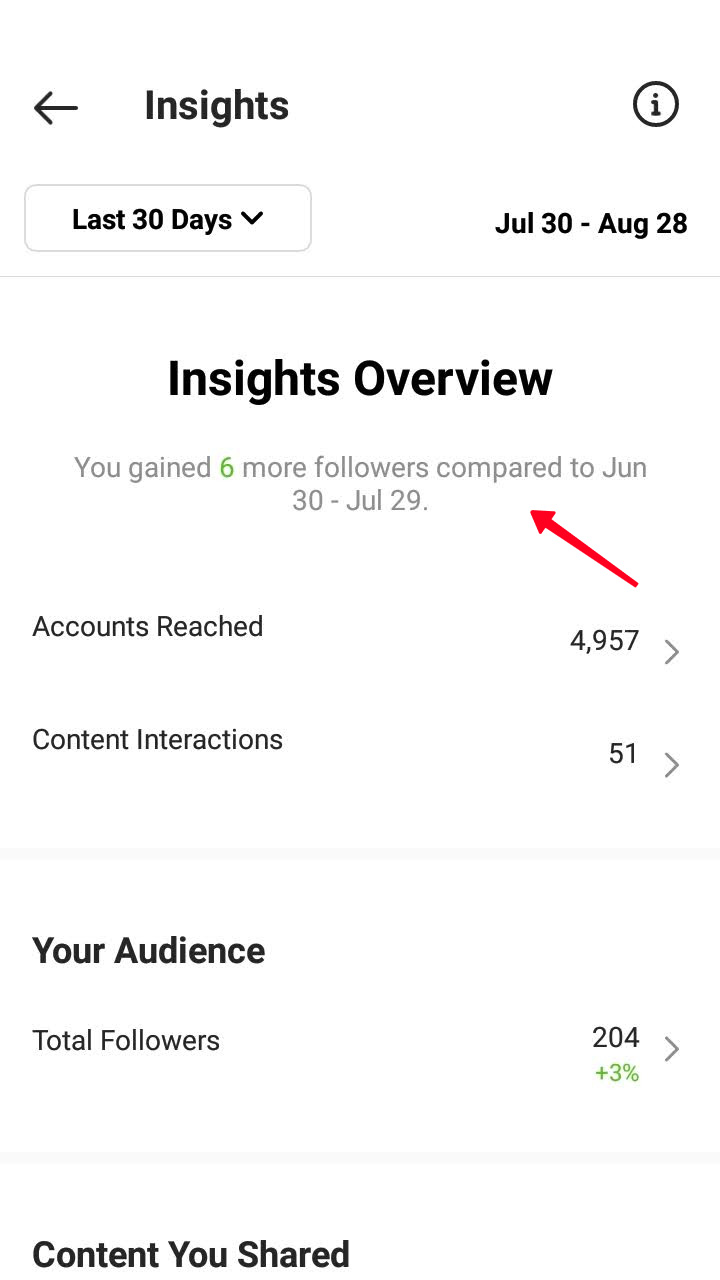
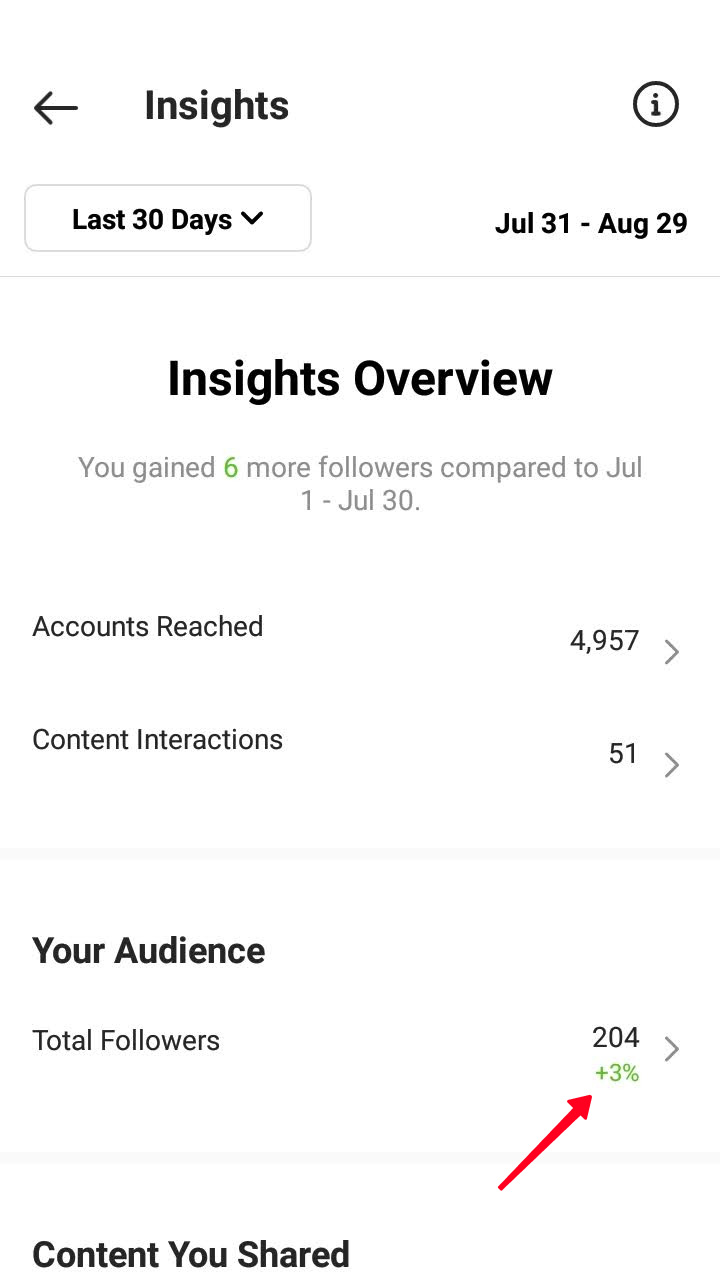
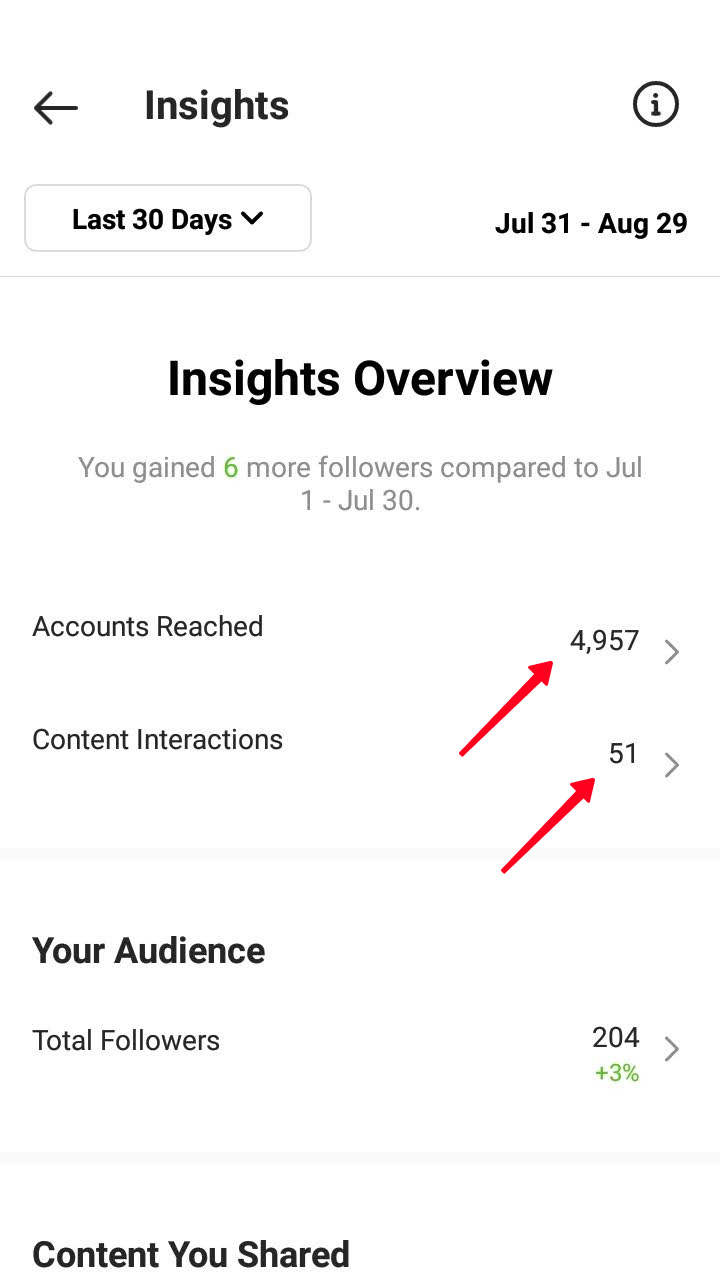
In the first line, you can see what metrics in Instagram Insights changed most of all. It compares two periods of the same length following one another. For periods of different lengths the displayed metric may differ.
Let's look at the examples to get a better understanding how to check Instagram Insights. During the last 14 days, our content has been watched by almost 500% more users than during the previous 14 days. But if we choose a 30 days time interval, Instagram shows gaining subscribers as the biggest improvement for the period.
If there wasn’t any improvement for the chosen period, IG suggests you take a deeper look at how your account and content are performing. Go to the sections below to see this in Instagram Insights.
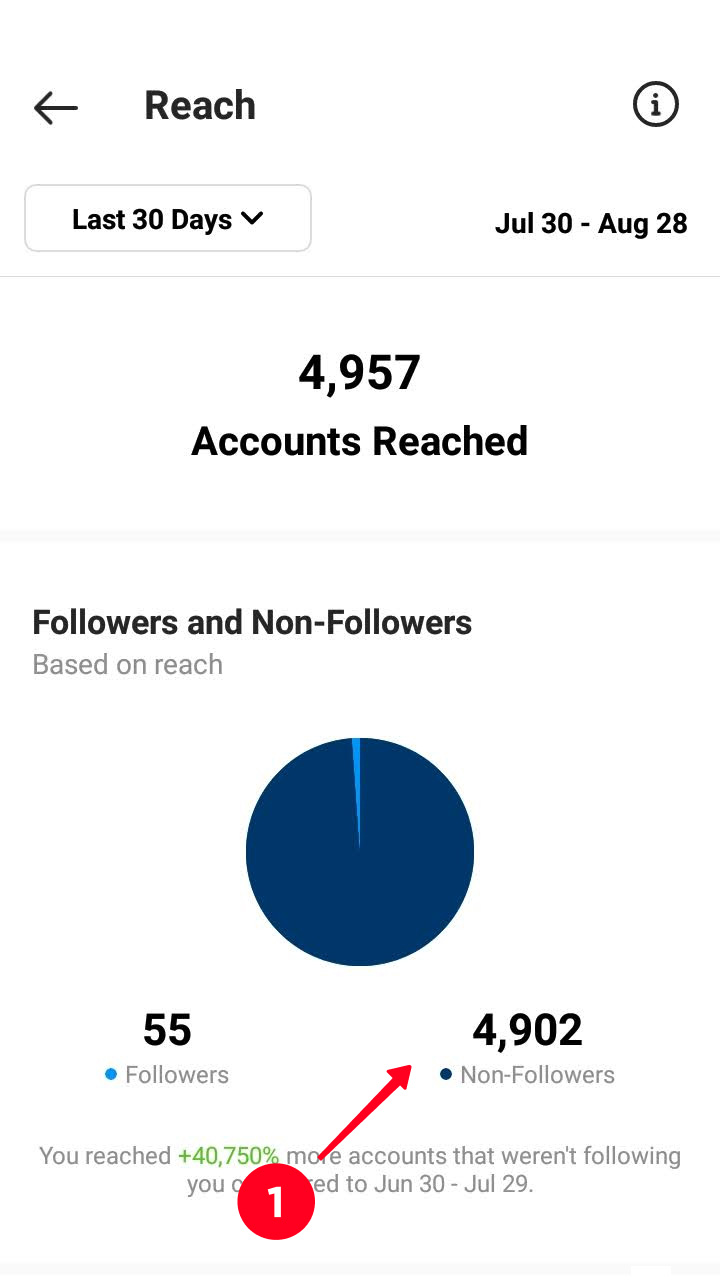
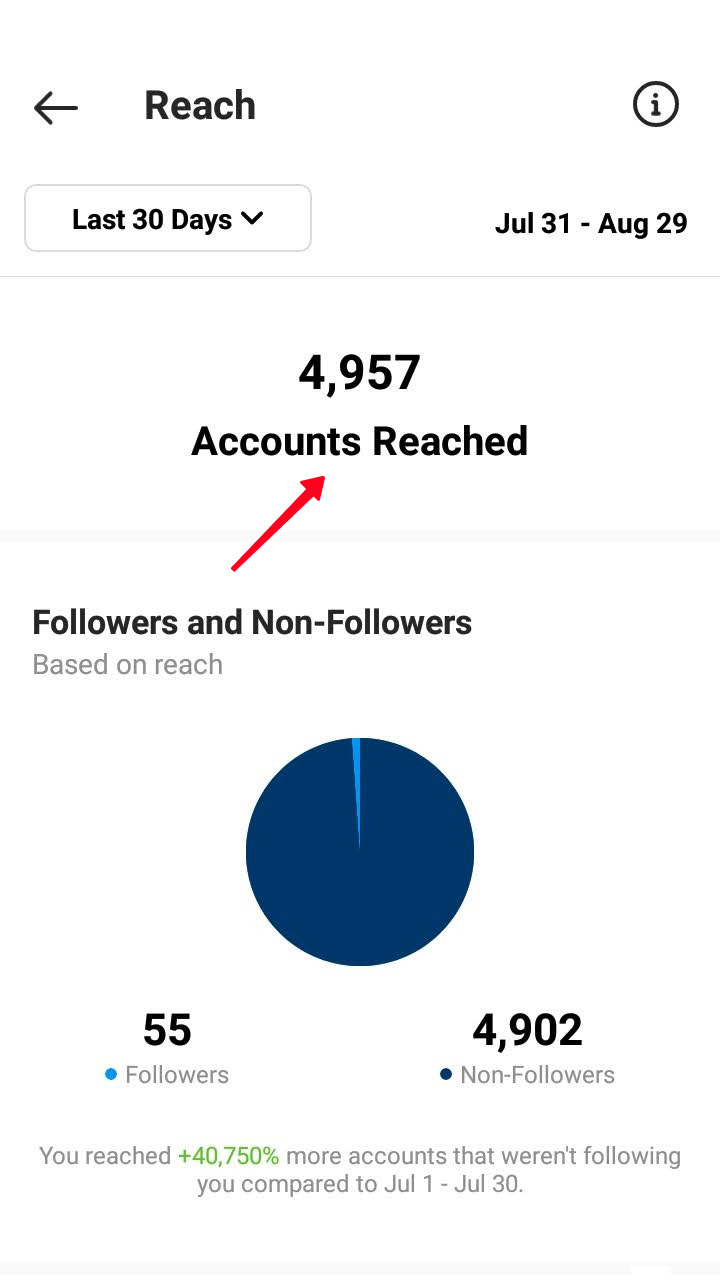
Accounts Reached shows the number of users who saw your content. Tap the section in your Instagram Insights to see more comprehensive statistics.
Under the number of users for the period, you’ll see the comparison with the previous period.
Below you can learn:
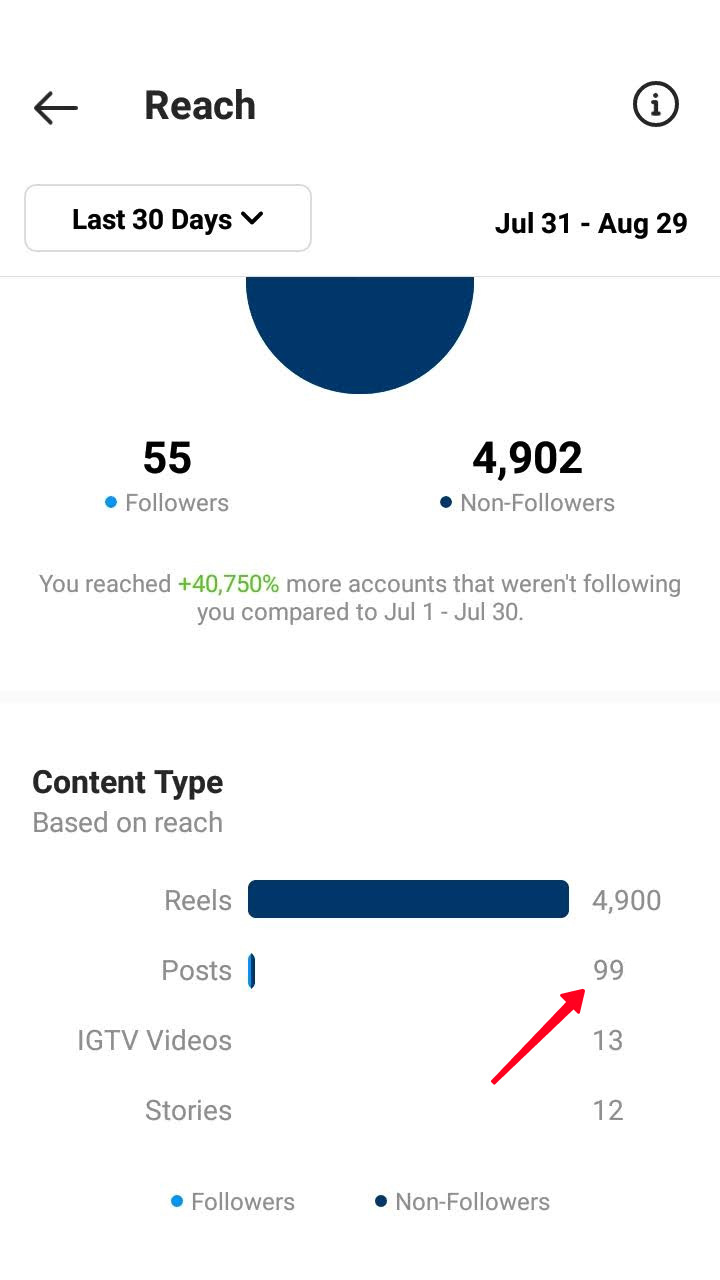
- How many users from your audience do not follow you (1).
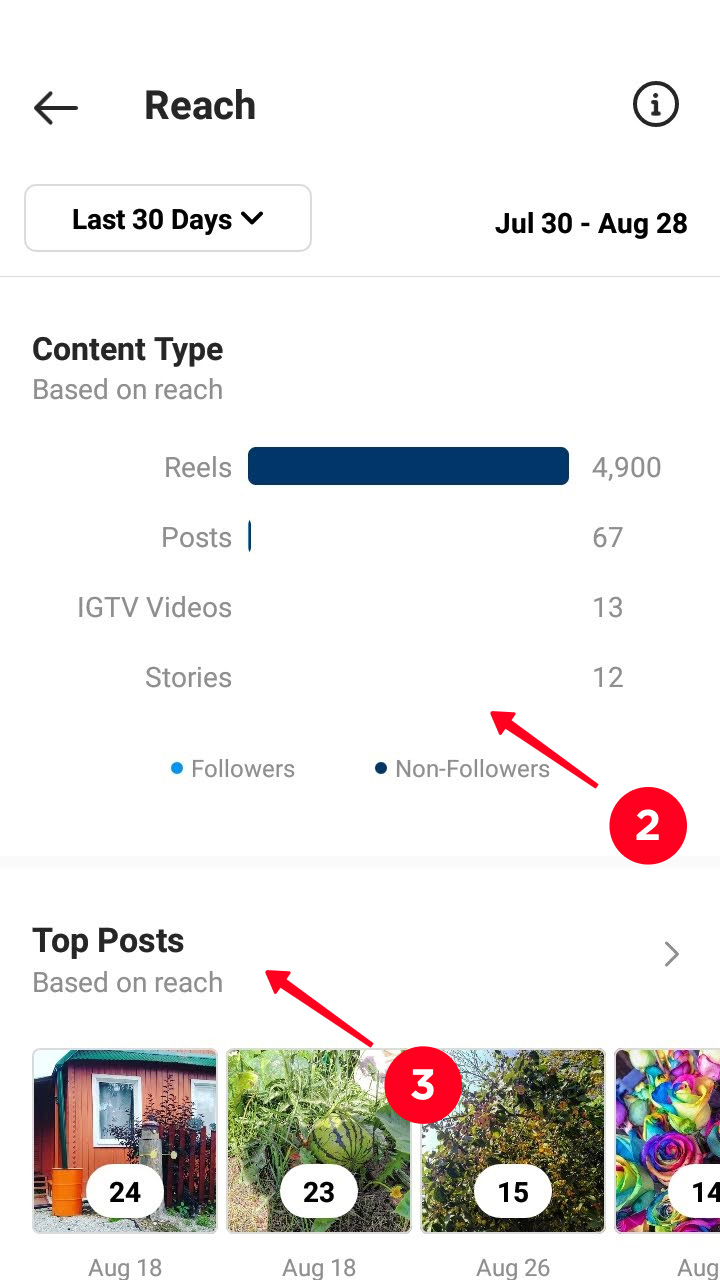
- What is the most popular content type (2).
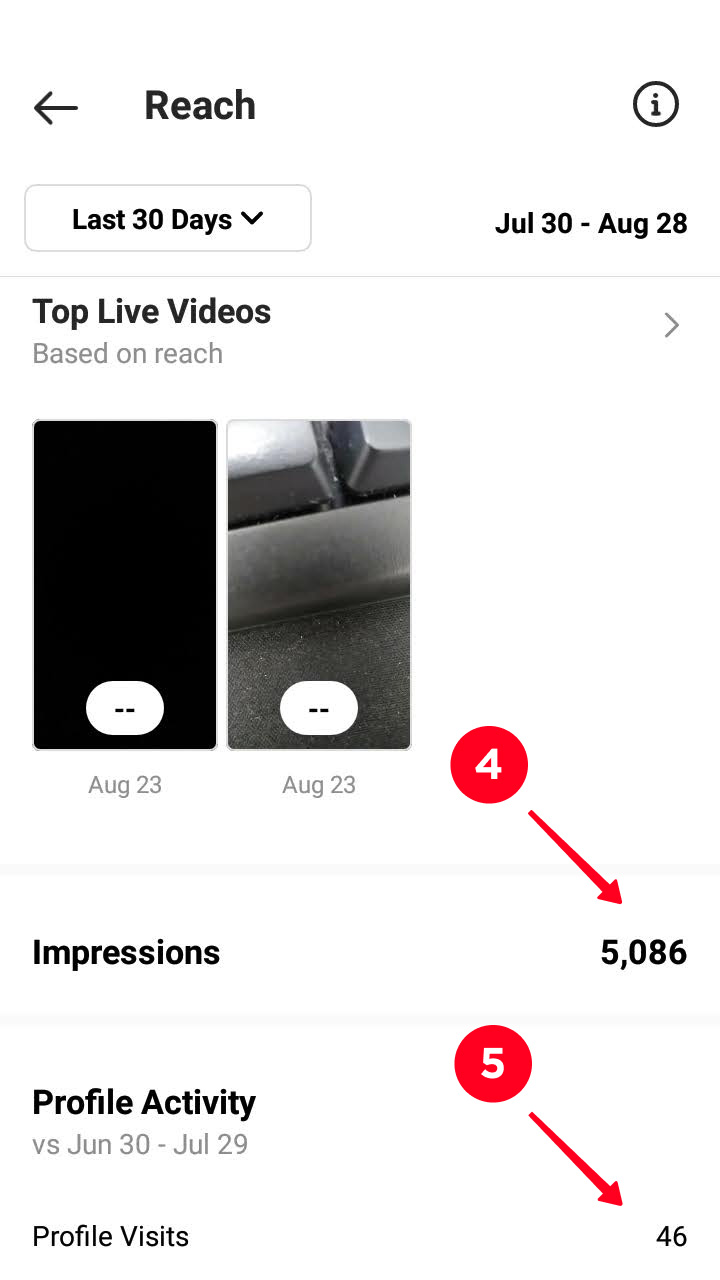
- The most popular Instagram posts, Stories, Reels, IGTV and Lives (3).
- How many times your content has been viewed (4).
- How many users went to your profile after seeing your content (5).
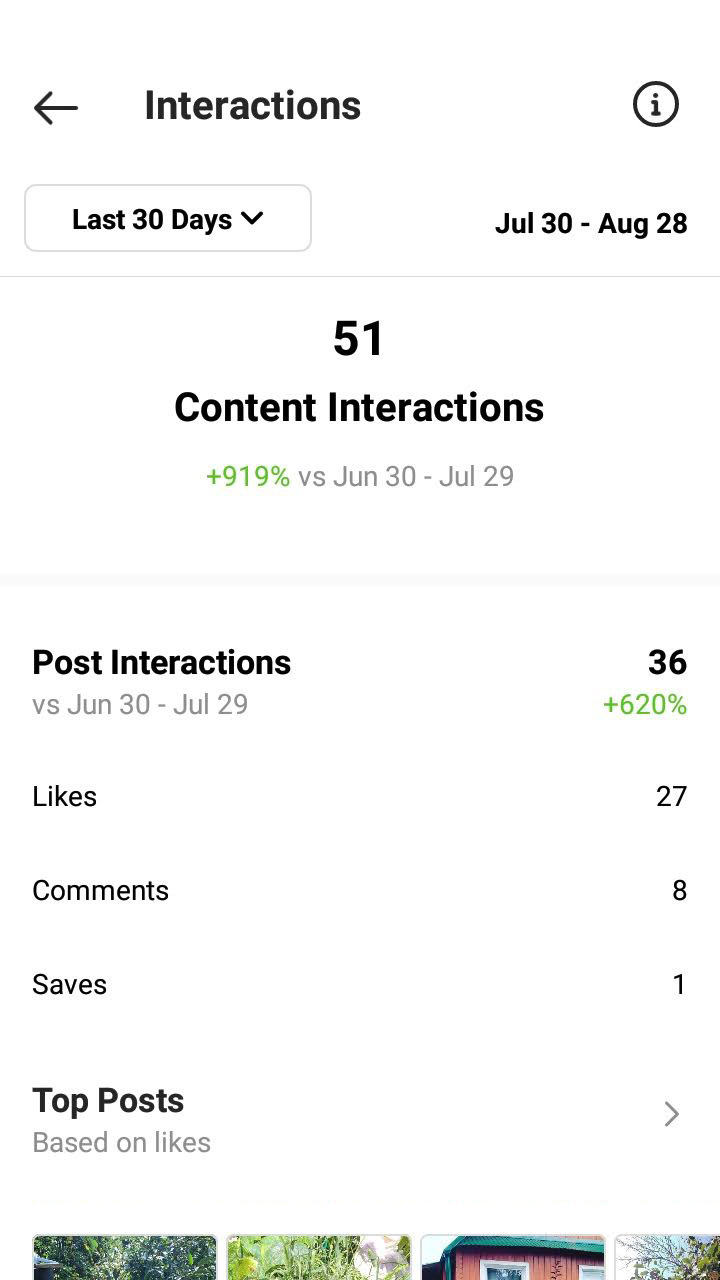
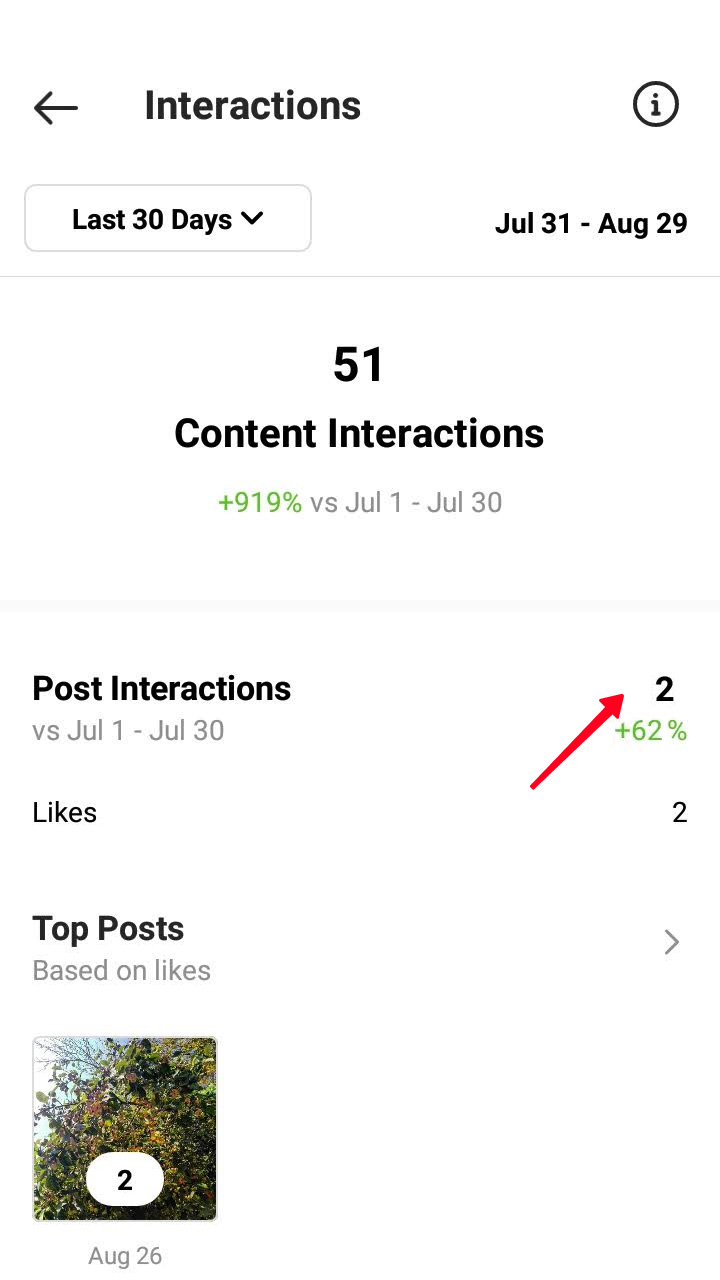
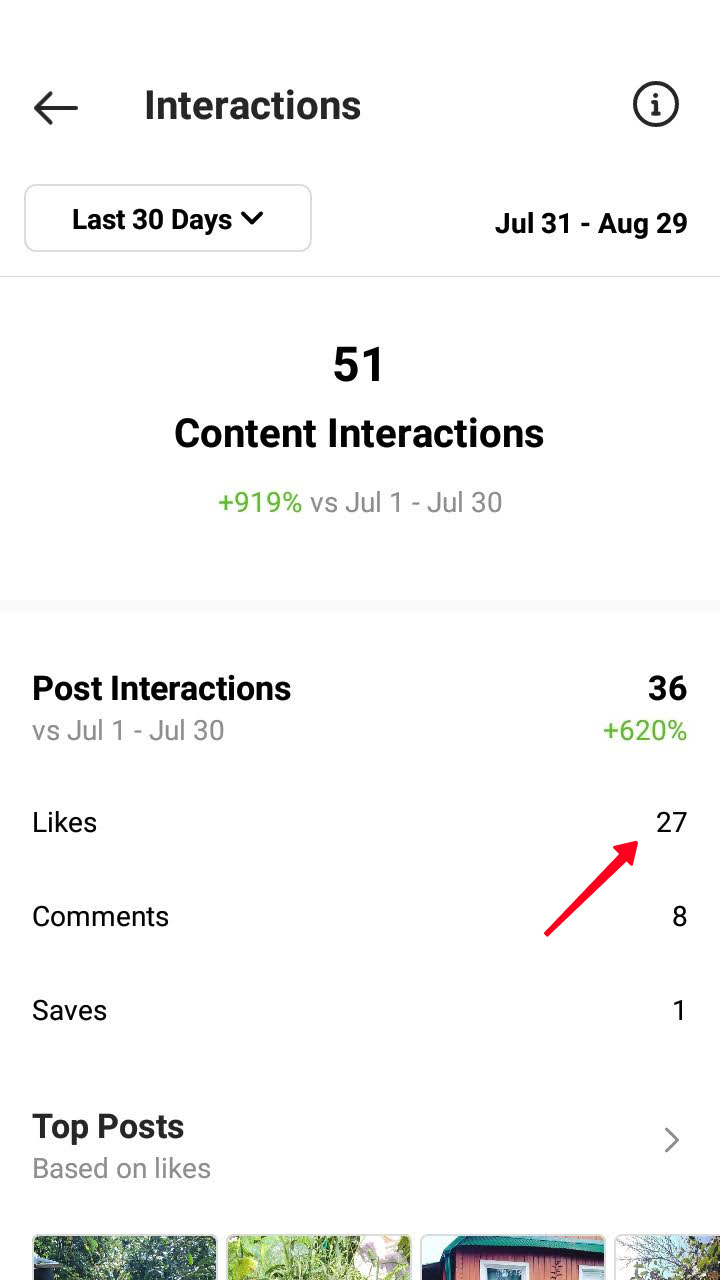
Now look how to check Interactions in Instagram Insights. This rate refers to the users’ reactions to your content. It includes likes, comments, saves and shares. Even if you turn off like count on Instagram, you will see its number here.
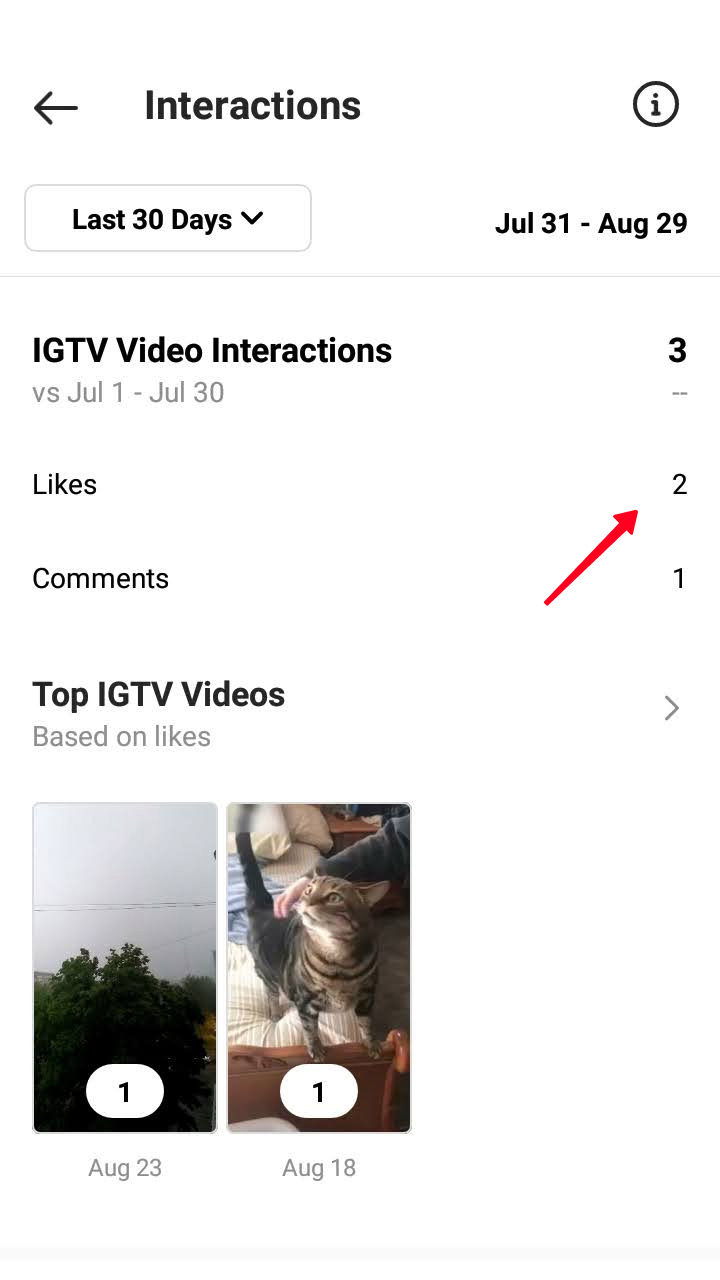
This section of Instagram Insights is divided by the type of content. Under each one you can see the dynamic in comparison with the previous period.
In this Instagram Insights section, you can view more about your subscribers. The metrics are available for those who've got more than 100 followers.
Look at the number at the top to check how many Instagram followers you’ve got during the period. Below you see the analytics — growth or falling of the number of followers during a chosen time interval.
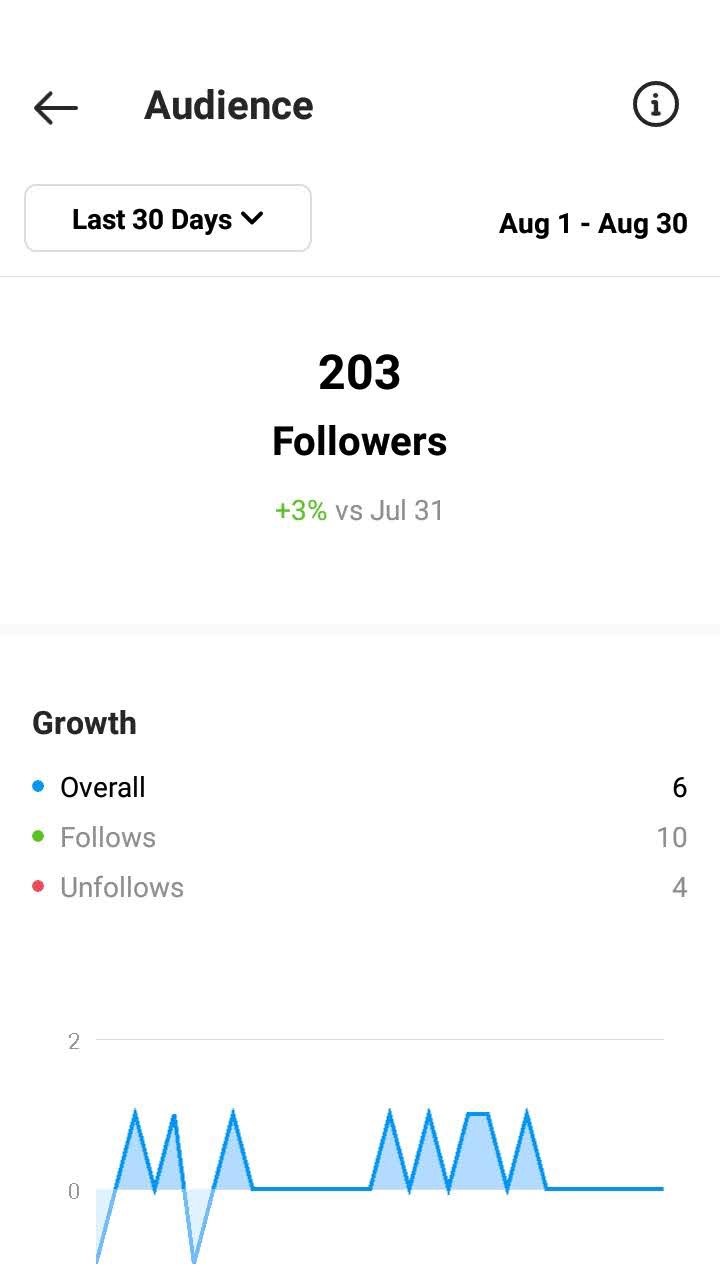
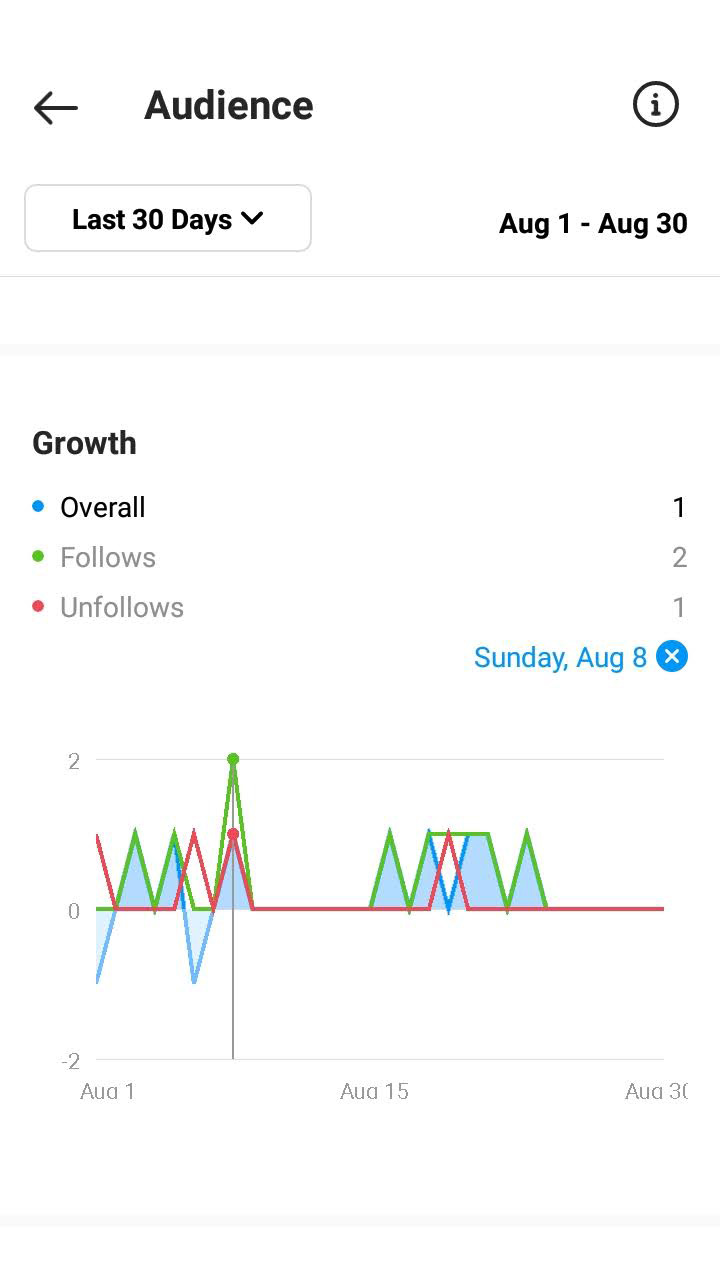
It is followed by the number of subscribed and unsubscribed users for the period. The graphic reveals daily Instagram stats. Get on a particular day, then the numbers will be shown for the date. Tap the cross appeared near the date to see the figures for the whole period again.
At the bottom you will see your Instagram followers Insights. There are location, gender, age and time of the highest activity metrics. This data is for all the followers you’ve got, not only for those gained in the chosen period.
The Content You Shared section is divided by the type of content. In each one you will see recently added photos and videos.
Tap on the content type and number to navigate to the sorting page. Each type of content has its own metrics to analyze.
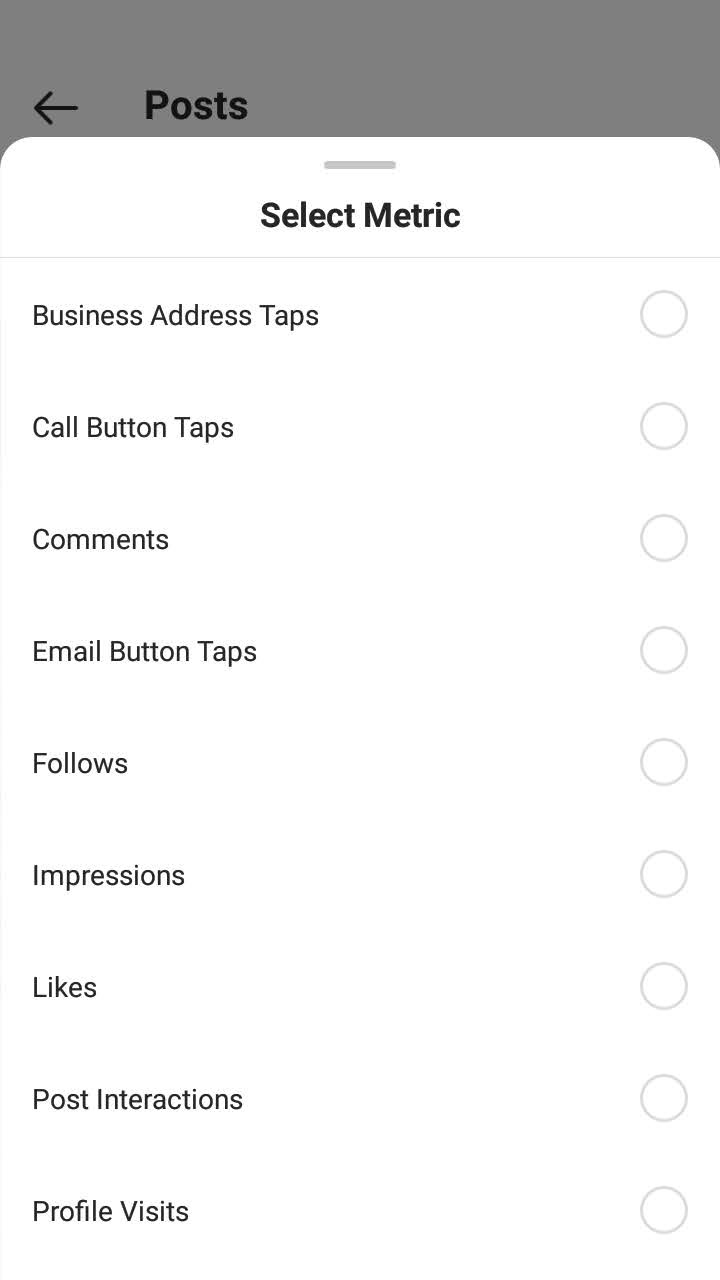
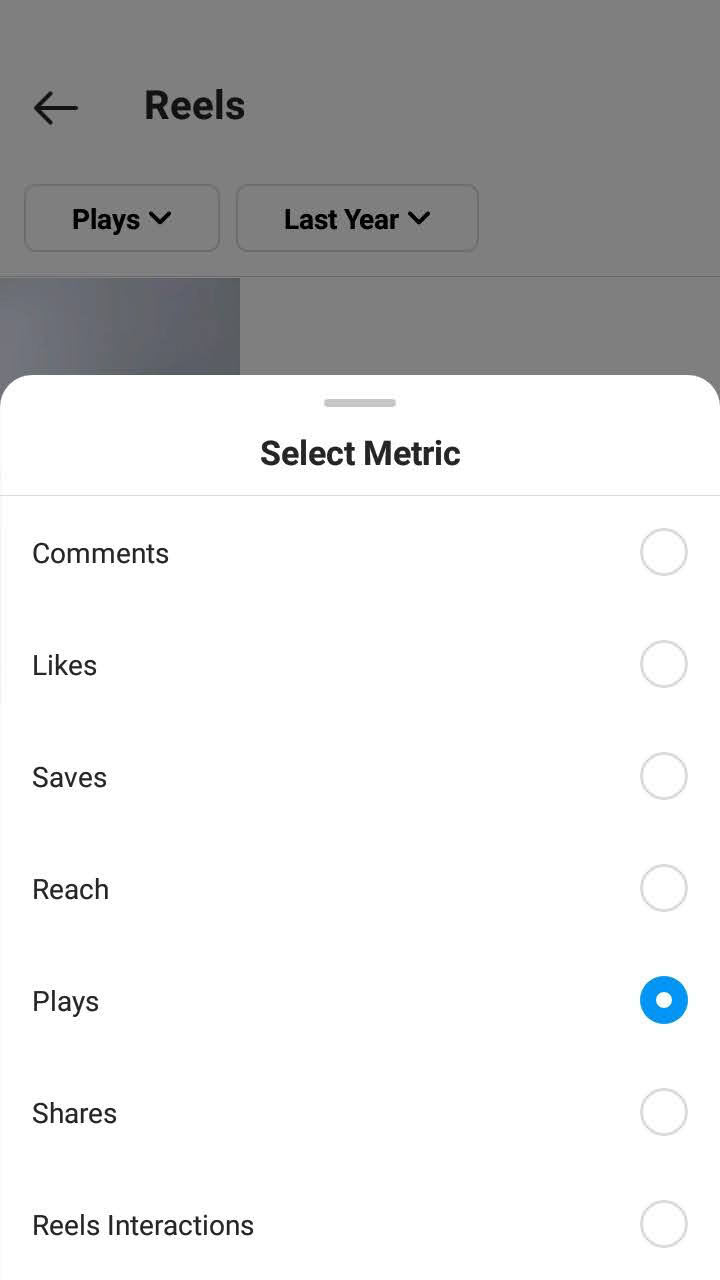
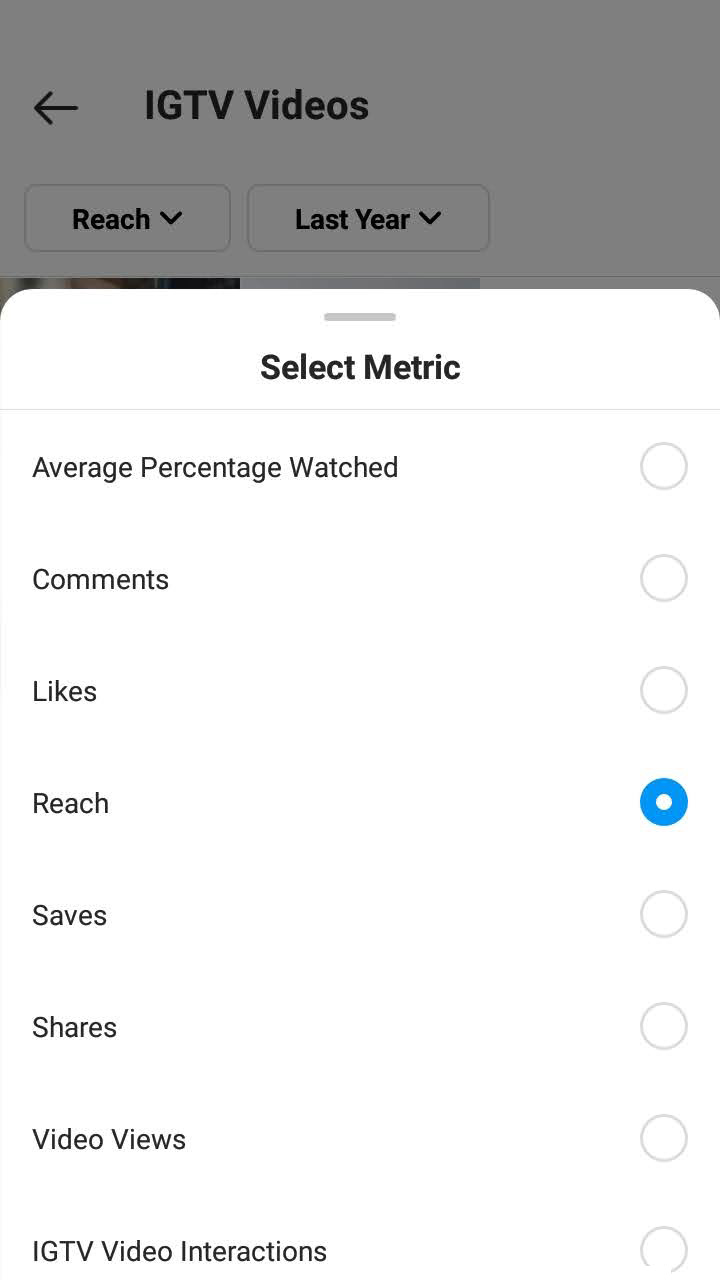
Open an Instagram post, Stories, Reels, IGTV, and tap View Insights. To see the data for Lives, just tap them from the Content You Shared page. In the Insights you’ll see all available metrics, but specifically for a chosen publication.
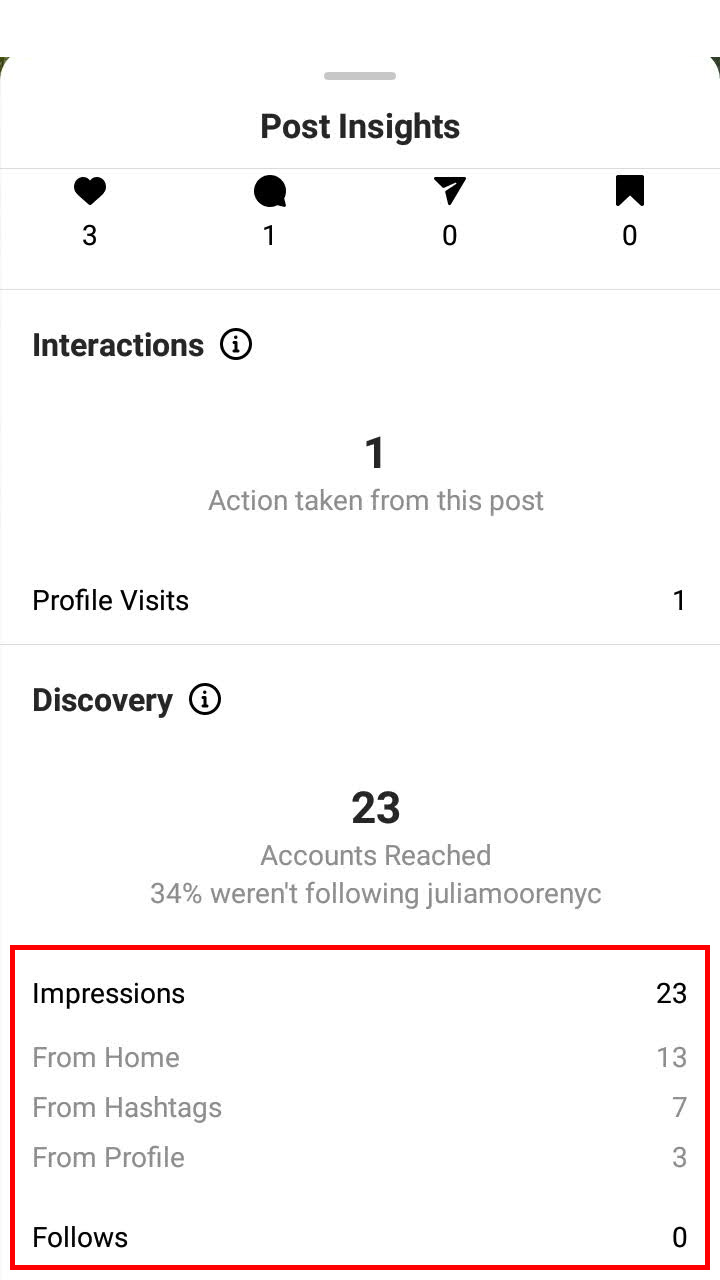
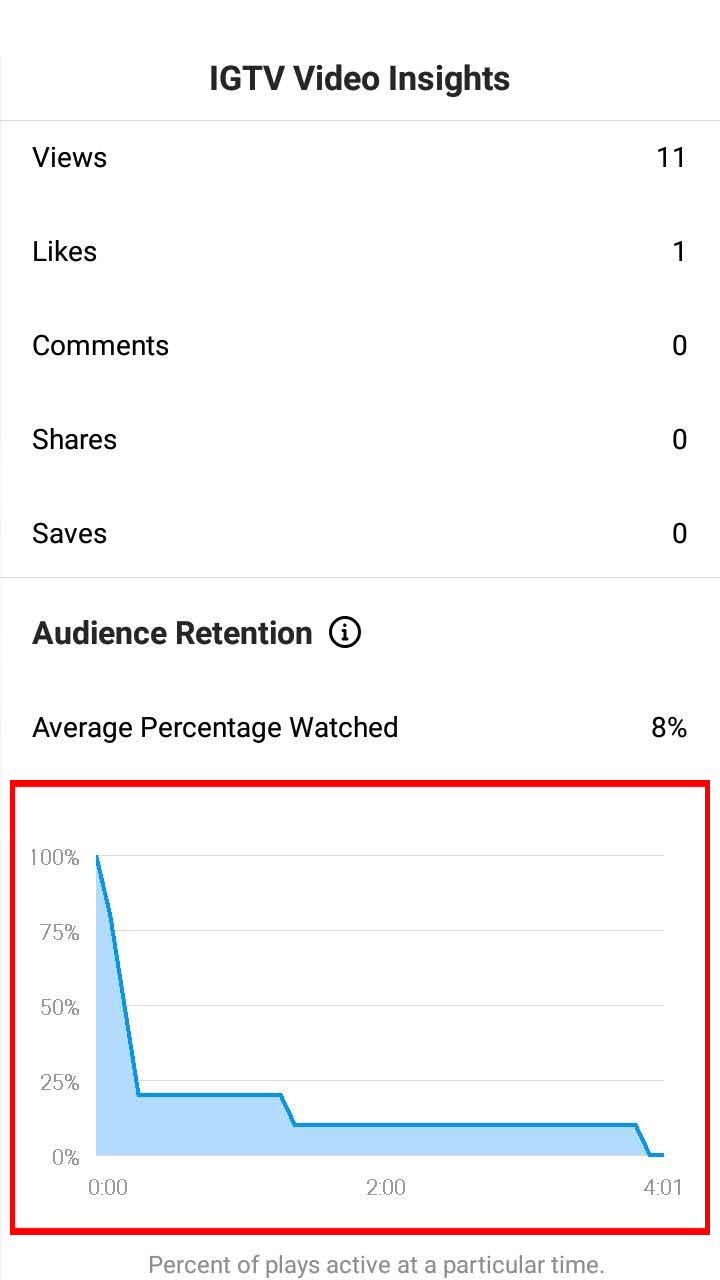
In post Instagram Insights, you can look at an extra metric to see where people viewed them. An IGTV metrics additionally tells you what time people leave the Instagram video.
From the Content You Shared page, you can see Instagram Insights for publications added in the profile for the last two years. Set a time filter to hide old publications, then it’ll be easier to check the new ones. Whatever period filter you choose, you get your Instagram publications Insights collected during all time since they’ve been added.
Now you know where to view Instagram Insights. Let's get to its understanding. To begin with, choose a time interval.
- If you add photos and videos on your profile every day, it makes sense to analyze 7 or 14 days.
- If more rarely — compare 30 days or 90 days periods.
Below we will tell you about several Instagram Insights indexes to appraise your account promotion. The bigger the index, the better. First of all compare your indexes with those you can calculate for the previous periods. Growing figures means development.
To make the possibilities clear, and to understand what stage you are at, we suggest using research data as guide standards. You can find it below.
If you watch the number of subscribers is growing — it’s good.
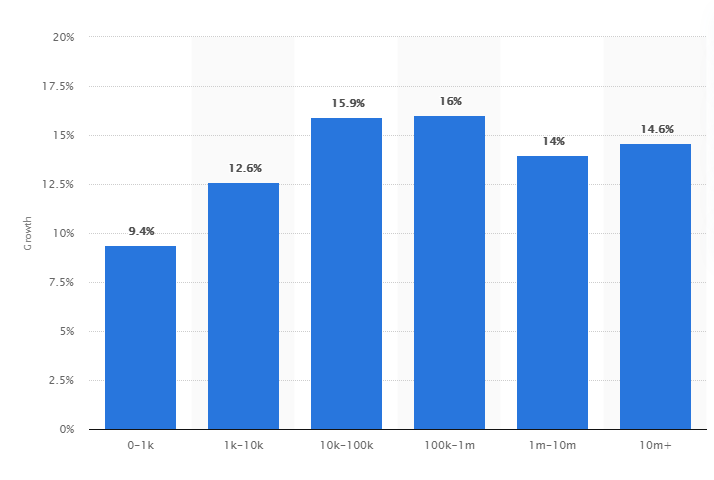
According to the statista.com data, the average followers growth for half a year is different and depends on the initial number of followers. On average it is 12.6%
Don’t enjoy watching your followers growth too much. Part of them might be bots. You should delete them. We wrote why and how to do it here. More to that, if your audience doesn't interact with your content, and does not even watch it, it’s a bad signal for the algorithms. Even if your content is incredible, small audience engagement will hinder your promotion.
Social insider in collaboration with bannersnack figured out Instagram average engagement rate for posts. It is 1.92% for photo posts, 1.74% for video, and 1.45% for carousels. The average Instagram engagement for all posts is 1.7%.
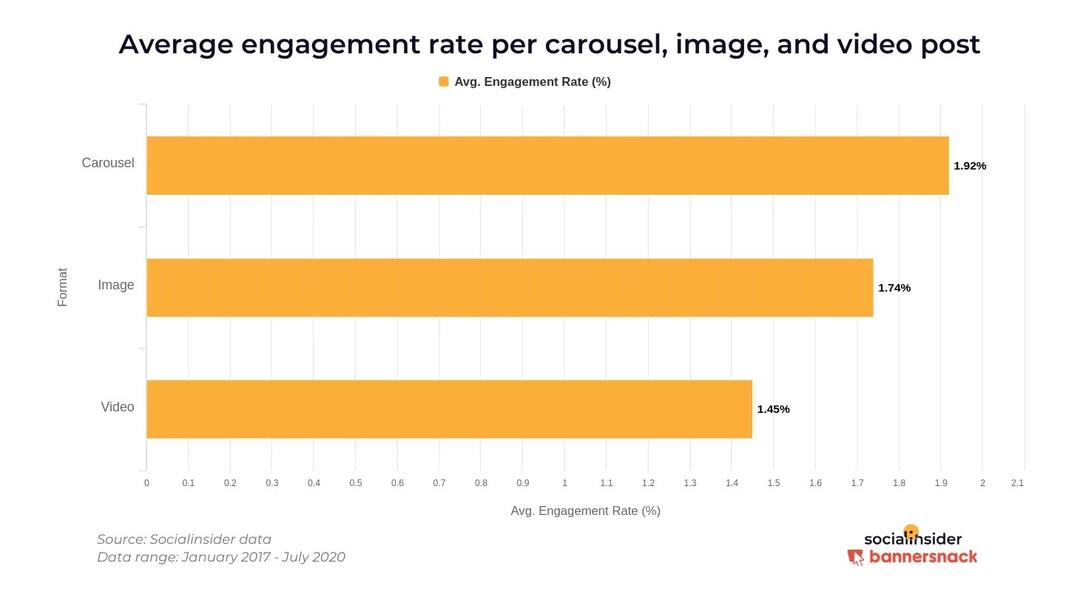
We suggest calculating the engagement for your Instagram posts. Compare it with the average engagement rate of 1.7% to get a sense of your social media marketing strategy effectiveness.
See Instagram Insights to understand what to publish. Likes tell us what photo and videos users like. At the same time you should consider the number of people who watched the content. If an Instagram post was liked by 10 people and watched by 1000, it is probably in favor of the audience. But not as much as the one liked by 10 people out of 100 watched.

You can see the like numbers in your post Insights on Instagram decreasing. Thus, the rate falls too. There can be two reasons. Understand your case and fixing the situation require the following calculations:
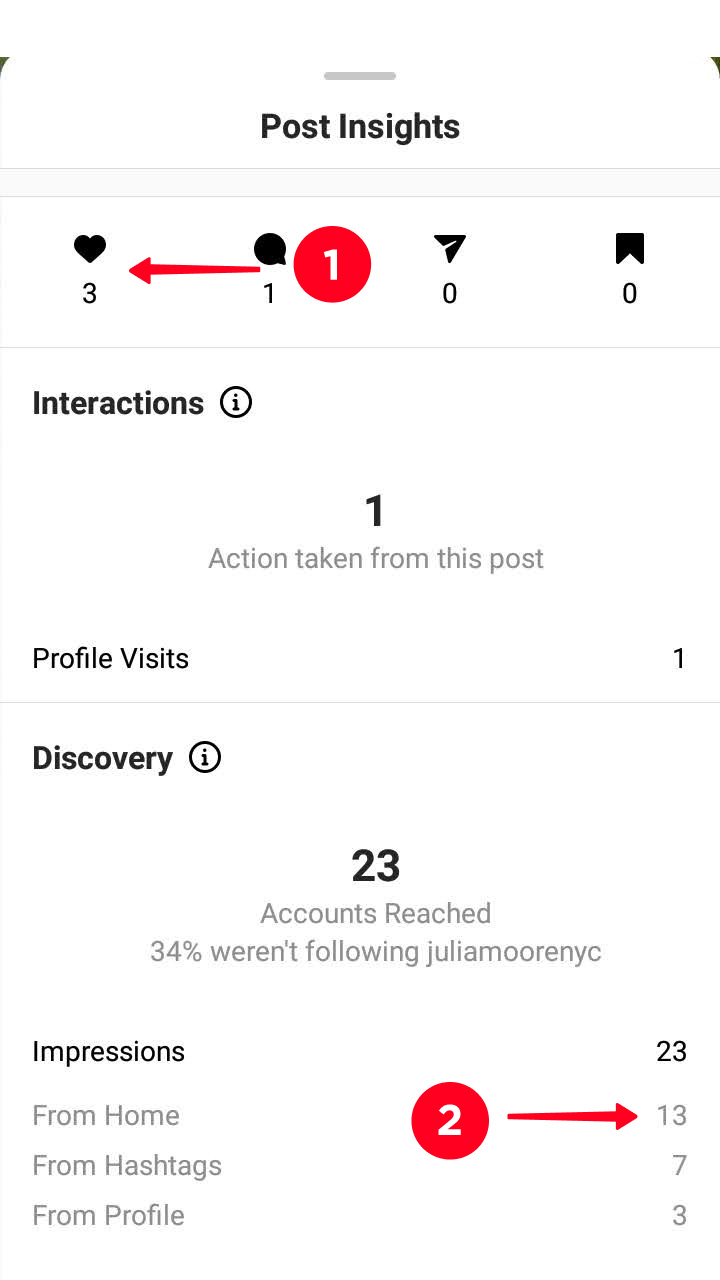
- How your followers like your Instagram post: likes on a post (1) / Impressions from the feed (2). Multiply the number by 100%. A lower than average result means you probably chose the wrong topic.
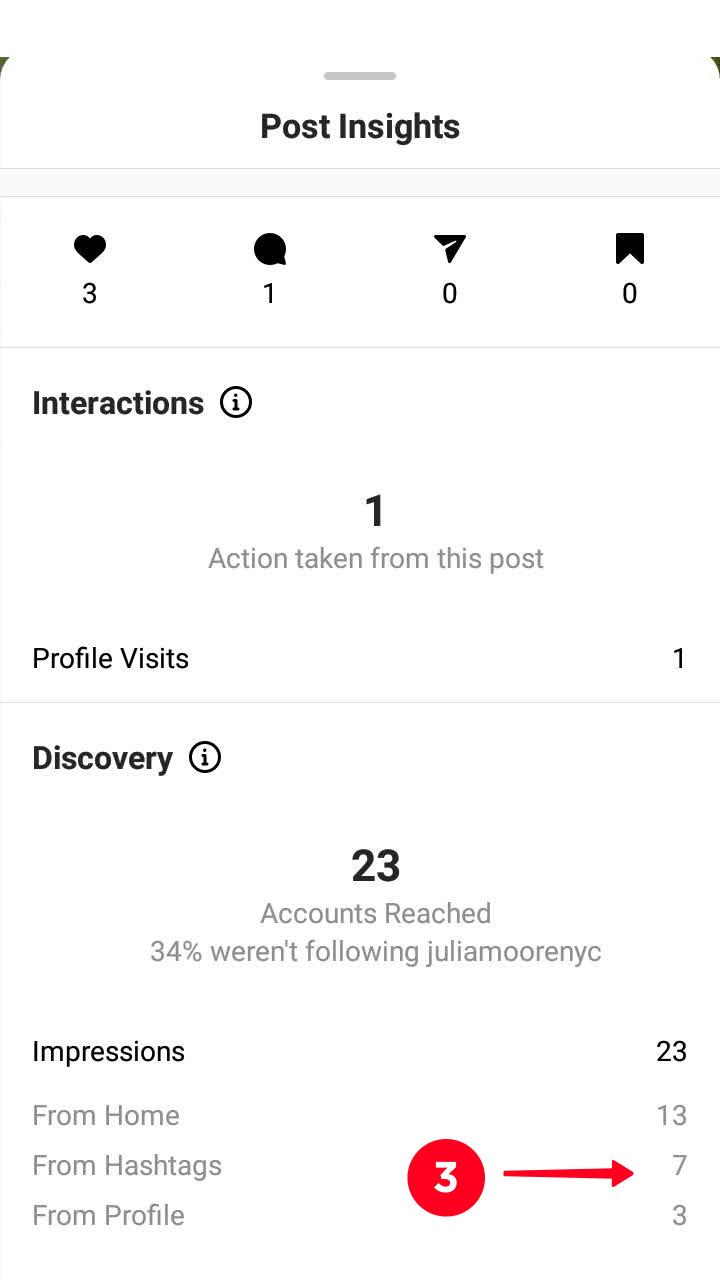
- How non-followers like a post: likes on a post / Impressions by hashtags (3). Then multiply by 100%. A small number might mean you chose the wrong hashtags.
Read the guide on how to use Instagram hashtags.
Analyze what content with the highest rate numbers has in common. Thus, you figure out what your audience likes most of all.
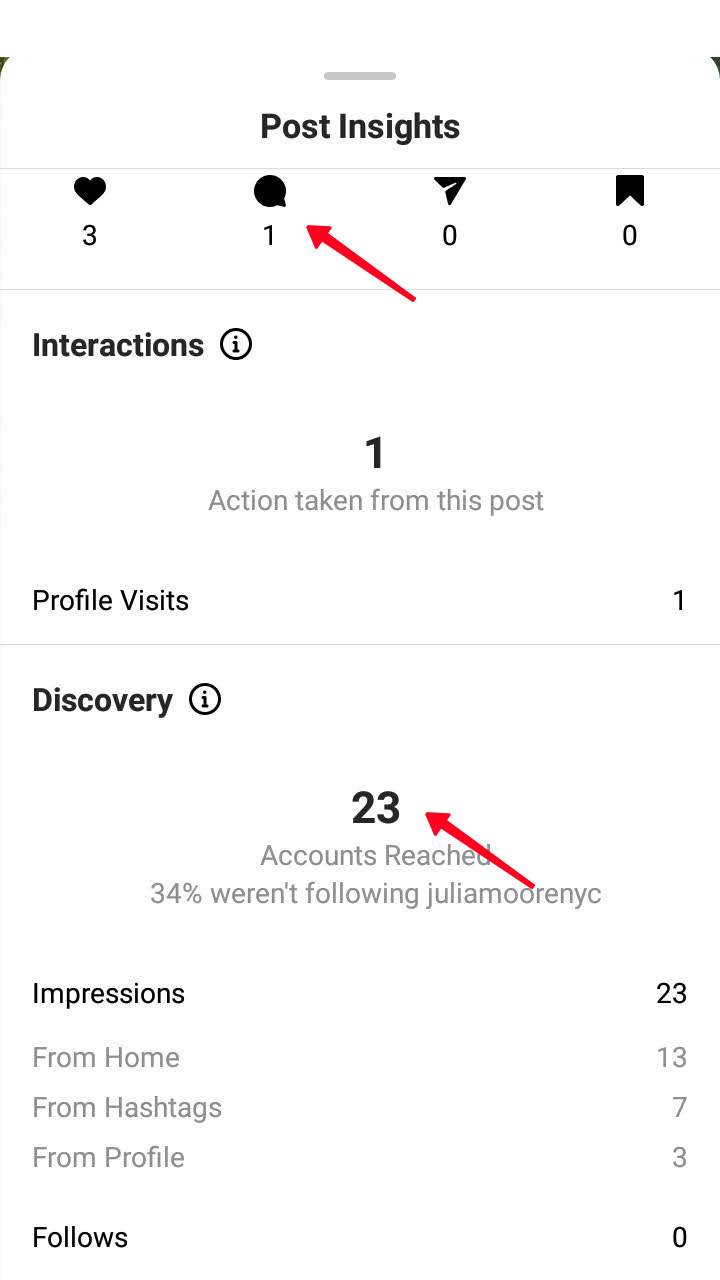
Regardless of whether the comments under your content are positive or negative, their presence in the Instagram Insights means you succeed at making your audience interested in it. They might be piqued by a photo or video, or the caption provoked them for a discussion. To find the pattern, first figure out the most discussed content.
The formula is applicable to an individual Instagram post or the video. Thus, you can monitor the general dynamic and know whether you are keeping the right direction.
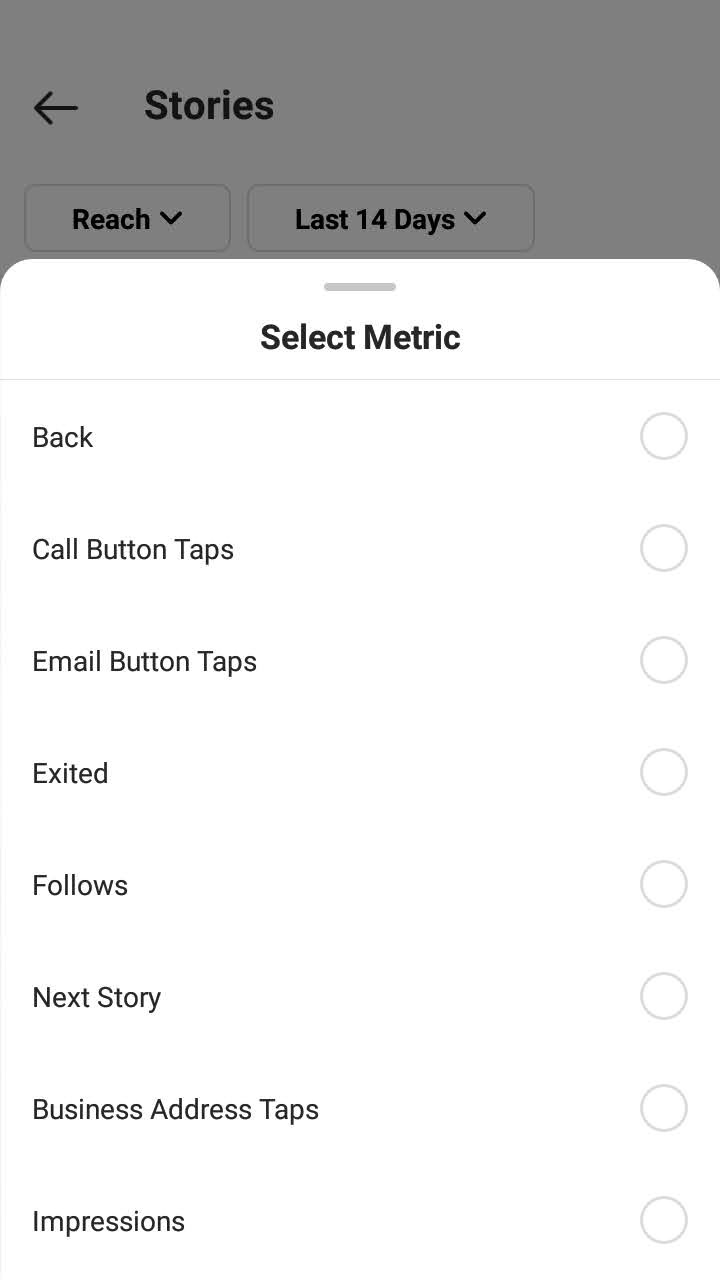
Use the same formulas to check your Instagram Stories Insights. But instead of Reach and Plays see Views in the Insights, and instead of likes — reactions.
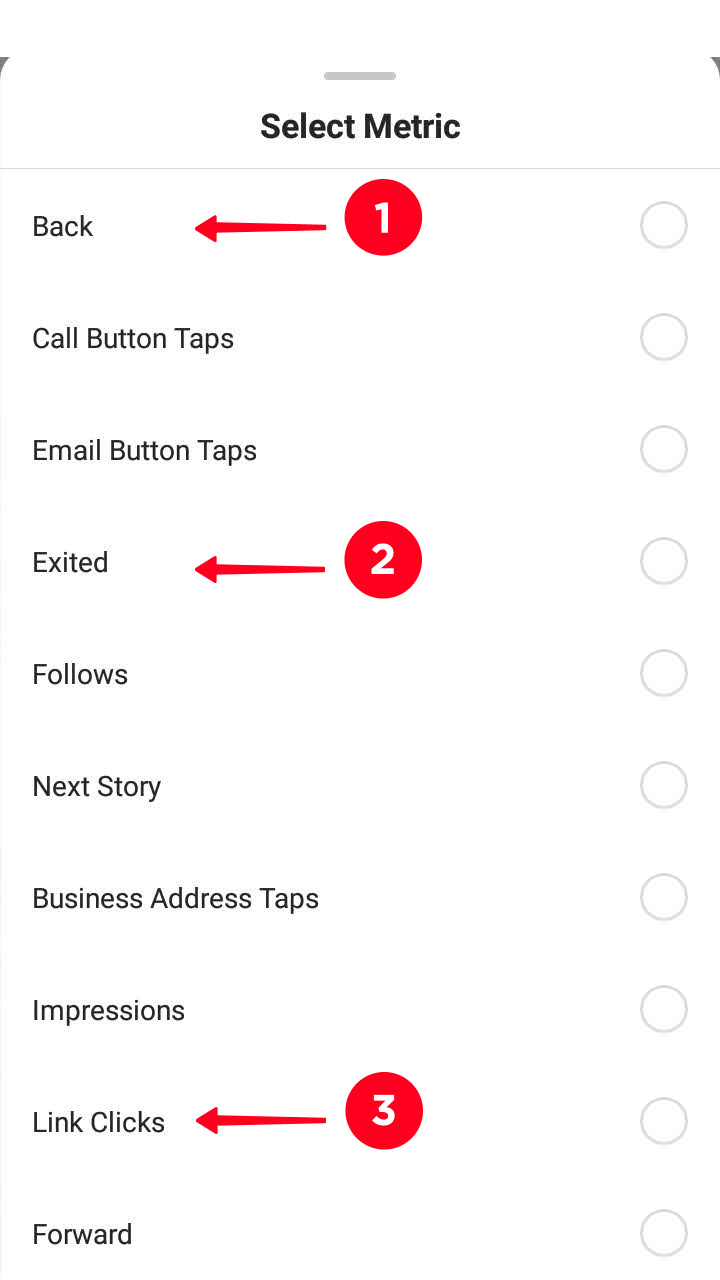
Besides, look at where users go from a Story. If Instagram Insights says they go back (1), it means they like the content and want to see it again. If exit (2) — just the opposite. Understanding what content motivated the users to navigate a link in a Story will also be useful (3).
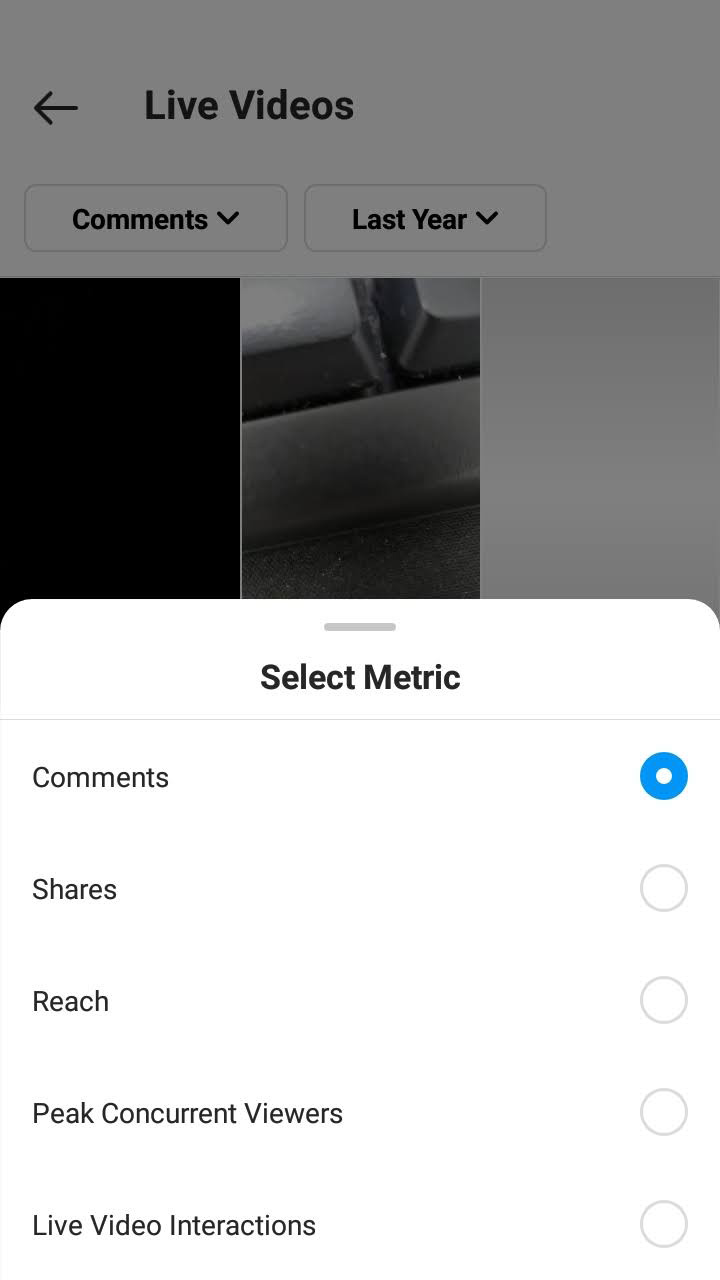
Live Videos metric that you should see in your Instagram Insights is Peak Concurrent Viewers. The bigger the number, the more your audience is interested in your Lives.
Most Active Times in your Instagram Insights help to understand when to publish content. You can find it in the Audience section.
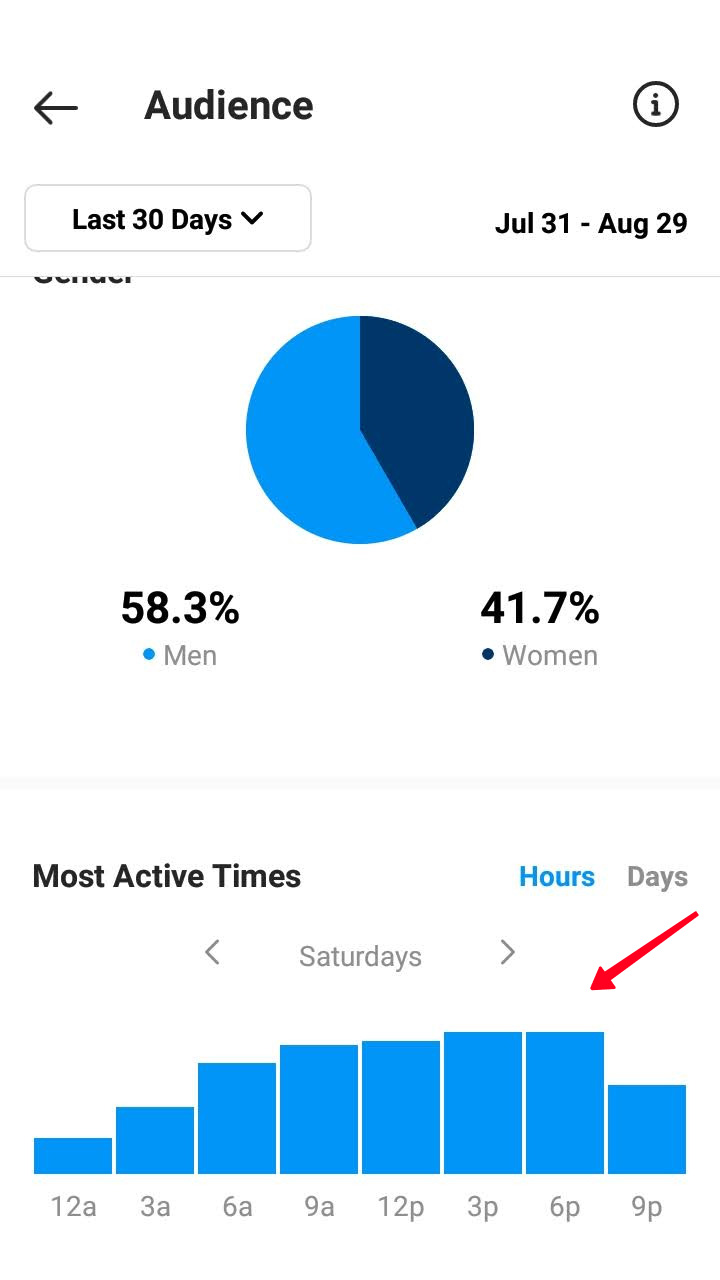
In this Instagram Insights section you can see your audience age, gender and location. Publish content which will be close to the people of such age, gender and country.
If you use Taplink, don’t forget about the statistics section available in the service. There are less metrics than in Instagram Insights, but they will give you sound knowledge about your audience.
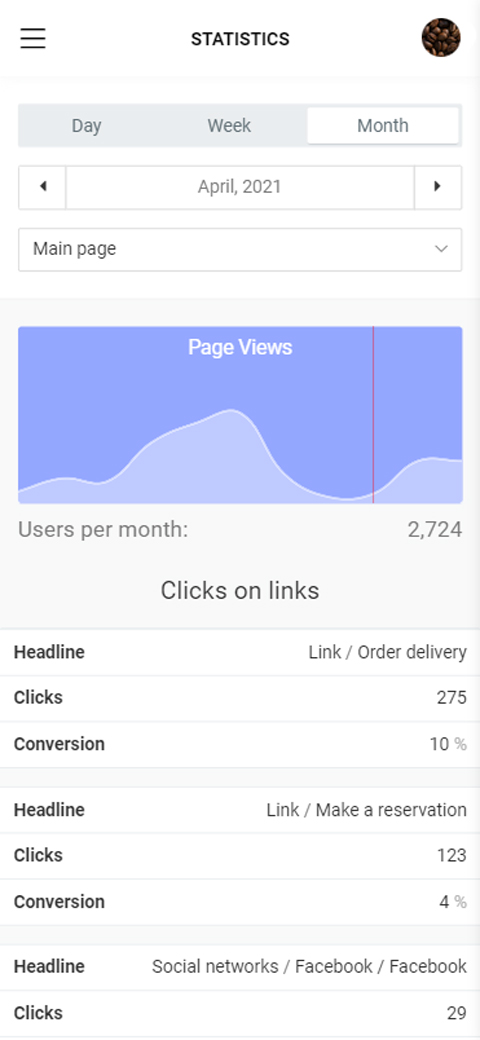
Clicks on links will give your Instagram audience insights — what thay are interested in most of all, and what chatting app they use more often. The statistics are represented both in numbers and demonstrable graphs. Use the section to get your Instagram audience insights:
— How to understand your audience to make money on Instagram.
If you are interested in Instagram promotion, but don’t use Taplink, it's prime time to sign up. The article that will help you:
In this article, we told you how to see and understand Instagram Insights. It does not give straight answers to the questions of what and when to post. Still, you should use its metrics to find the answers yourself.
Calculate the engagement individually for a post, Story, Reel and IGTV to understand what content interests your audience most of all. Calculate the average engagement and followers growth to estimate the effectiveness of your social media marketing strategy.